Teliti setiap ETF. Bandingkan segalanya.
Kepemilikan, biaya, kinerja, imbal hasil, arus dana, dan berita untuk 5,788 ETF yang terdaftar di A.S.
ETF terbesar · diwarnai berdasarkan pergerakan hari ini (tertunda)
Gambaran pasar melalui ETF benchmark terbesar (kuotasi tertunda), bukan level indeks. Per Oct 22, 2026 08:38 UTC.
10 Teratas ETF
Lihat Peringkat Lengkap →Imbal Hasil Tertinggi
| ETF | Harga | Hari Ini | Yield (TTM) | AUM | |
|---|---|---|---|---|---|
| SMCY YieldMax SMCI Option Income Strategy ETF | 4.42 | +8.07% | 135.22% | $114.7M | |
| HOOY YieldMax HOOD Option Income Strategy ETF | 24.14 | +3.47% | 113.00% | $144.3M | |
| MSTY YieldMax MSTR Option Income Strategy ETF | 15.27 | +6.04% | 102.76% | $1.02B | |
| HOOW Roundhill Investments - HOOD WeeklyPay ETF | 23.04 | +4.35% | 101.56% | $127.1M | |
| CONY YieldMax COIN Option Income Strategy ETF | 18.75 | +3.19% | 91.64% | $354.7M | |
| SLVO UBS ETRACS Silver Shares Covered Call ETN | 60.46 | -0.57% | 77.43% | $377.6M |
Kinerja Terbaik (YTD)
| ETF | Harga | Hari Ini | AUM | |
|---|---|---|---|---|
| MRNY YieldMax MRNA Option Income Strategy ETF | 46.57 | +1.06% | $244.5M | |
| BNO United States Brent Oil Fund LP | 67.05 | +0.27% | $846.1M | |
| USO United States Oil Fund, LP | 159.80 | -0.50% | $1.89B | |
| UGA United States Gasoline Fund, LP | 141.07 | +0.07% | $161.8M | |
| DBE Invesco DB Energy Fund | 39.14 | -0.53% | $145.2M | |
| DBO Invesco DB Oil Fund | 25.65 | -0.08% | $284.6M |
ETF Terbesar
| ETF | Harga | Hari Ini | AUM | |
|---|---|---|---|---|
| VTI Vanguard Morningstar Total Stock Market ETF | 379.15 | +0.55% | $2.30T | |
| VOO Vanguard S&P 500 ETF | 710.72 | +0.55% | $1.70T | |
| IVV iShares Core S&P 500 ETF | 776.65 | +0.56% | $885.77B | |
| SPY State Street SPDR S&P 500 ETF | 773.09 | +0.53% | $818.39B | |
| VXUS Vanguard Total International Stock ETF | 84.00 | +0.31% | $649.30B | |
| QQQ Invesco QQQ Trust, Series 1 | 725.20 | +1.05% | $484.69B |
Paling Aktif
| ETF | Harga | Hari Ini | Volume | Vol vs Rata-rata | |
|---|---|---|---|---|---|
| NVD GraniteShares 2x Short NVDA Daily ETF | 3.82 | -4.98% | 109.87M | — | |
| TSLG Themes ETF Trust - Leverage Shares 2X Long… | 5.27 | +6.68% | 81.87M | — | |
| BITO ProShares Bitcoin ETF | 11.28 | +2.50% | 81.51M | — | |
| SOXL Direxion Daily Semiconductor Bull 3X ETF | 103.24 | +5.83% | 76.31M | — | |
| MSTZ T-REX 2X Inverse MSTR Daily Target ETF | 2.47 | -14.83% | 75.87M | — | |
| TSLL Direxion Daily TSLA Bull 2X ETF | 10.52 | +6.69% | 74.07M | — |
ETF Tren
| ETF | Harga | Hari Ini | Vol vs Rata-rata | YTD | |
|---|---|---|---|---|---|
| DLLL GraniteShares 2x Long DELL Daily ETF | 25.66 | +10.18% | — | +794.08% | |
| MSTU T-REX 2X Long MSTR Daily Target ETF | 38.08 | +15.11% | — | -54.18% | |
| MSTX Daily Target 2X Long MSTR ETF | 17.44 | +14.89% | — | -54.70% | |
| CRDU Tradr 2X Long CRDO Daily ETF | 7.58 | +12.46% | — | -32.86% | |
| SOXS Direxion Daily Semiconductor Bear 3X ETF | 44.29 | -6.03% | — | -92.14% | |
| CRWL GraniteShares 2x Long CRWD Daily ETF | 82.91 | +10.48% | — | +169.10% |
Biaya Terendah
| ETF | Harga | Hari Ini | Biaya | AUM | |
|---|---|---|---|---|---|
| BKAG BNY Mellon Core Bond ETF | 40.29 | 0.00% | 0.00% | $1.46B | |
| BKLC BNY Mellon US Large Cap Core Equity ETF | 49.42 | +0.59% | 0.00% | $6.83B | |
| BBUS JPMorgan BetaBuilders U.S. Equity ETF | 139.51 | +0.60% | 0.02% | $9.64B | |
| SPYM State Street SPDR Portfolio S&P 500 ETF | 90.99 | +0.51% | 0.02% | $183.47B | |
| AGG iShares Core U.S. Aggregate Bond ETF | 95.30 | +0.03% | 0.03% | $138.36B | |
| BIV Vanguard Intermediate-Term Bond ETF | 73.38 | -0.04% | 0.03% | $50.40B |
Trending ETFs adalah skor perhatian kami sendiri (volume, berita, kunjungan halaman, estimasi aliran dana), sebagai ukuran popularitas dan bukan kualitas investasi. Market data delayed approximately 15–20 minutes unless otherwise indicated.
Pergerakan Hari Ini
Kinerja →Penguatan Terbesar
| ETF | Harga | Hari Ini | AUM | |
|---|---|---|---|---|
| NRR Bitwise NEAR ETF | 27.77 | +9.24% | $83.0M | |
| MSTW Roundhill Investments - MSTR WeeklyPay ETF | 4.67 | +9.11% | $86.1M | |
| SMCY YieldMax SMCI Option Income Strategy ETF | 4.42 | +8.07% | $114.7M | |
| MSTY YieldMax MSTR Option Income Strategy ETF | 15.27 | +6.04% | $1.02B | |
| PLTW Roundhill Investments - PLTR WeeklyPay ETF | 25.89 | +5.50% | $138.1M | |
| NASA Tema Space Innovators ETF | 21.55 | +5.22% | $965.8M |
Pelemahan Terbesar
| ETF | Harga | Hari Ini | AUM | |
|---|---|---|---|---|
| UNG United States Natural Gas Fund LP | 9.97 | -5.05% | $470.2M | |
| CHIQ Global X - MSCI China Consumer Discretionary… | 15.68 | -3.57% | $101.4M | |
| KWEB KraneShares CSI China Internet ETF | 23.74 | -2.51% | $4.50B | |
| PGJ Invesco Golden Dragon China ETF | 21.53 | -2.41% | $80.8M | |
| EMQQ EMQQ The Emerging Markets Internet ETF | 30.83 | -2.31% | $236.4M | |
| SMIN iShares MSCI India Small-Cap ETF | 67.39 | -2.23% | $692.8M |
Penggerak tidak termasuk dana berleverage dan inverse serta dana dengan aset di bawah $50 juta. Market data delayed approximately 15–20 minutes unless otherwise indicated.
Aliran Dana (estimasi)
Peringkat aliran dana lengkap →Diperkirakan dari snapshot AUM harian ETF Explorer dikurangi efek pergerakan pasar; bukan data aliran dana resmi dari penerbit. Metodologi tersedia di halaman Metodologi.
Peluncuran ETF Baru
Semua peluncuran →| ETF | Harga | Hari Ini | Terdaftar | Biaya | AUM | |
|---|---|---|---|---|---|---|
| GMIE GMO International Equity Fund ETF | 25.25 | -0.19% | Oct 21, 2026 | 0.00% | $0.00 | |
| AHYM Allspring High Yield Municipal Bond Fund -… | 25.04 | -0.14% | Oct 21, 2026 | 0.00% | $0.00 | |
| AHIC Allspring Short-Term High Income Fund - ETF… | 25.07 | +0.02% | Oct 21, 2026 | 0.45% | $2.55B | |
| TLCE Thrivent Large Cap Stock ETF | 25.31 | -0.03% | Oct 21, 2026 | 0.30% | $0.00 | |
| POMG PRIMECAP Odyssey Discovery ETF | 25.52 | -0.16% | Oct 21, 2026 | 0.00% | $0.00 | |
| ASTM Allspring Strategic Municipal Bond Fund - ETF… | 25.00 | -0.10% | Oct 21, 2026 | 0.00% | $0.00 |
Kategori Populer
Semua kategori →Berita ETF
Semua berita →


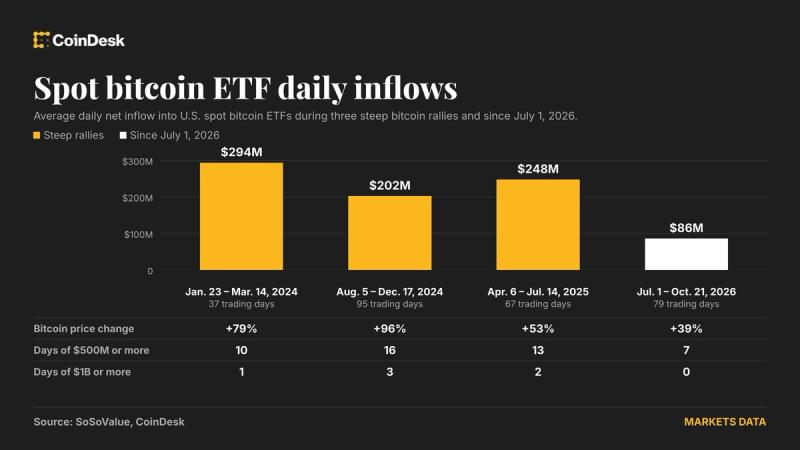
Ringkasan data ditulis secara internal dari data cache kami


Panduan bantuan: AUM adalah total dana yang dikelola. Expense ratio adalah biaya tahunannya: 0,10% berarti $10 per $10.000 per tahun. Yield (TTM) adalah kas yang dibayarkan dana selama 12 bulan terakhir dibagi harganya. Klik ticker mana pun untuk halaman riset lengkap, atau bintang untuk menyimpannya.